 ar
ar bg
bg hr
hr cs
cs da
da nl
nl fi
fi fr
fr de
de el
el hi
hi it
it ko
ko no
no pl
pl pt
pt ro
ro ru
ru es
es sv
sv tl
tl iw
iw id
id lv
lv lt
lt sr
sr sk
sk sl
sl uk
uk vi
vi et
et hu
hu th
th tr
tr fa
fa ms
ms hy
hy ka
ka ur
ur bn
bn mn
mn ta
ta kk
kk uz
uz ku
ku
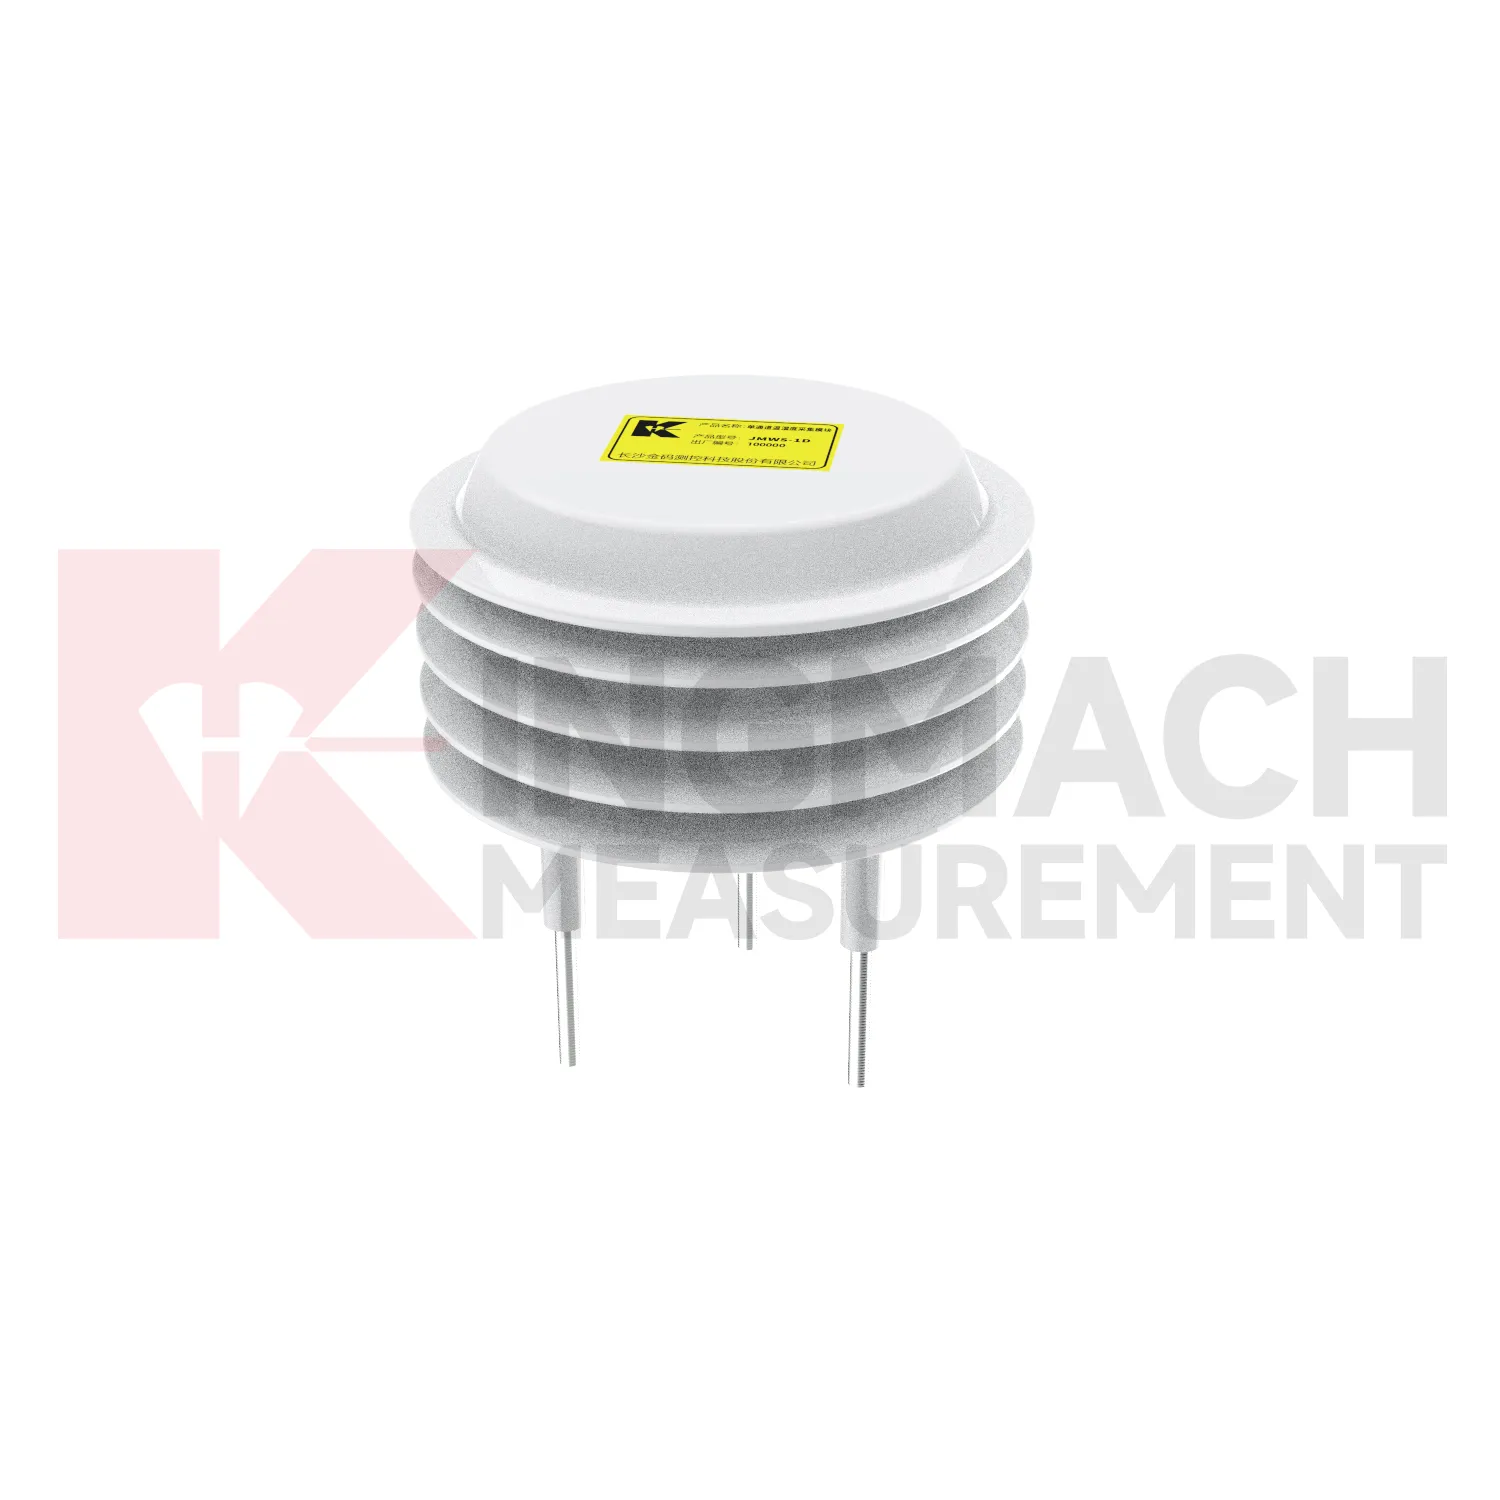
Temperature and Humidity Acquisition Module
Durability in Kingmach Temperature and Humidity Acquisition Module is not only a product property; it is a field practice. Outdoor stations face rain, dust, sun, wind, insects, corrosion, ice, and accidental impact. Buried points face soil movement, water, cable strain, and excavation risk. Indoor and underground points face condensation, heat, poor ventilation, and cable congestion. Enclosures, connectors, glands, poles, brackets, grounding, and drainage all affect whether the record stays usable. A durable station should be easy to inspect without disturbing the measurement. It should also have a visible maintenance history so a future reviewer knows whether a strange reading followed a storm, a repair, a cleaning visit, or a real environmental event. This is how field reliability becomes data reliability.
If the reading seems unusual, the team should check the physical condition of the station before drawing conclusions about the asset. Blockage, poor exposure, loose wiring, water entry, and changed surroundings can all create misleading patterns.
A practical report links the condition value with time, place, and action. It should help a reviewer decide whether to keep observing, inspect the field point, compare nearby instruments, or record the event as normal site behavior.
For owners, the strongest record is the one that remains understandable after staff changes. Clear units, plain point names, installation photos, maintenance notes, and linked structural channels make the data usable beyond the original project team.
Application of Temperature and Humidity Acquisition Module
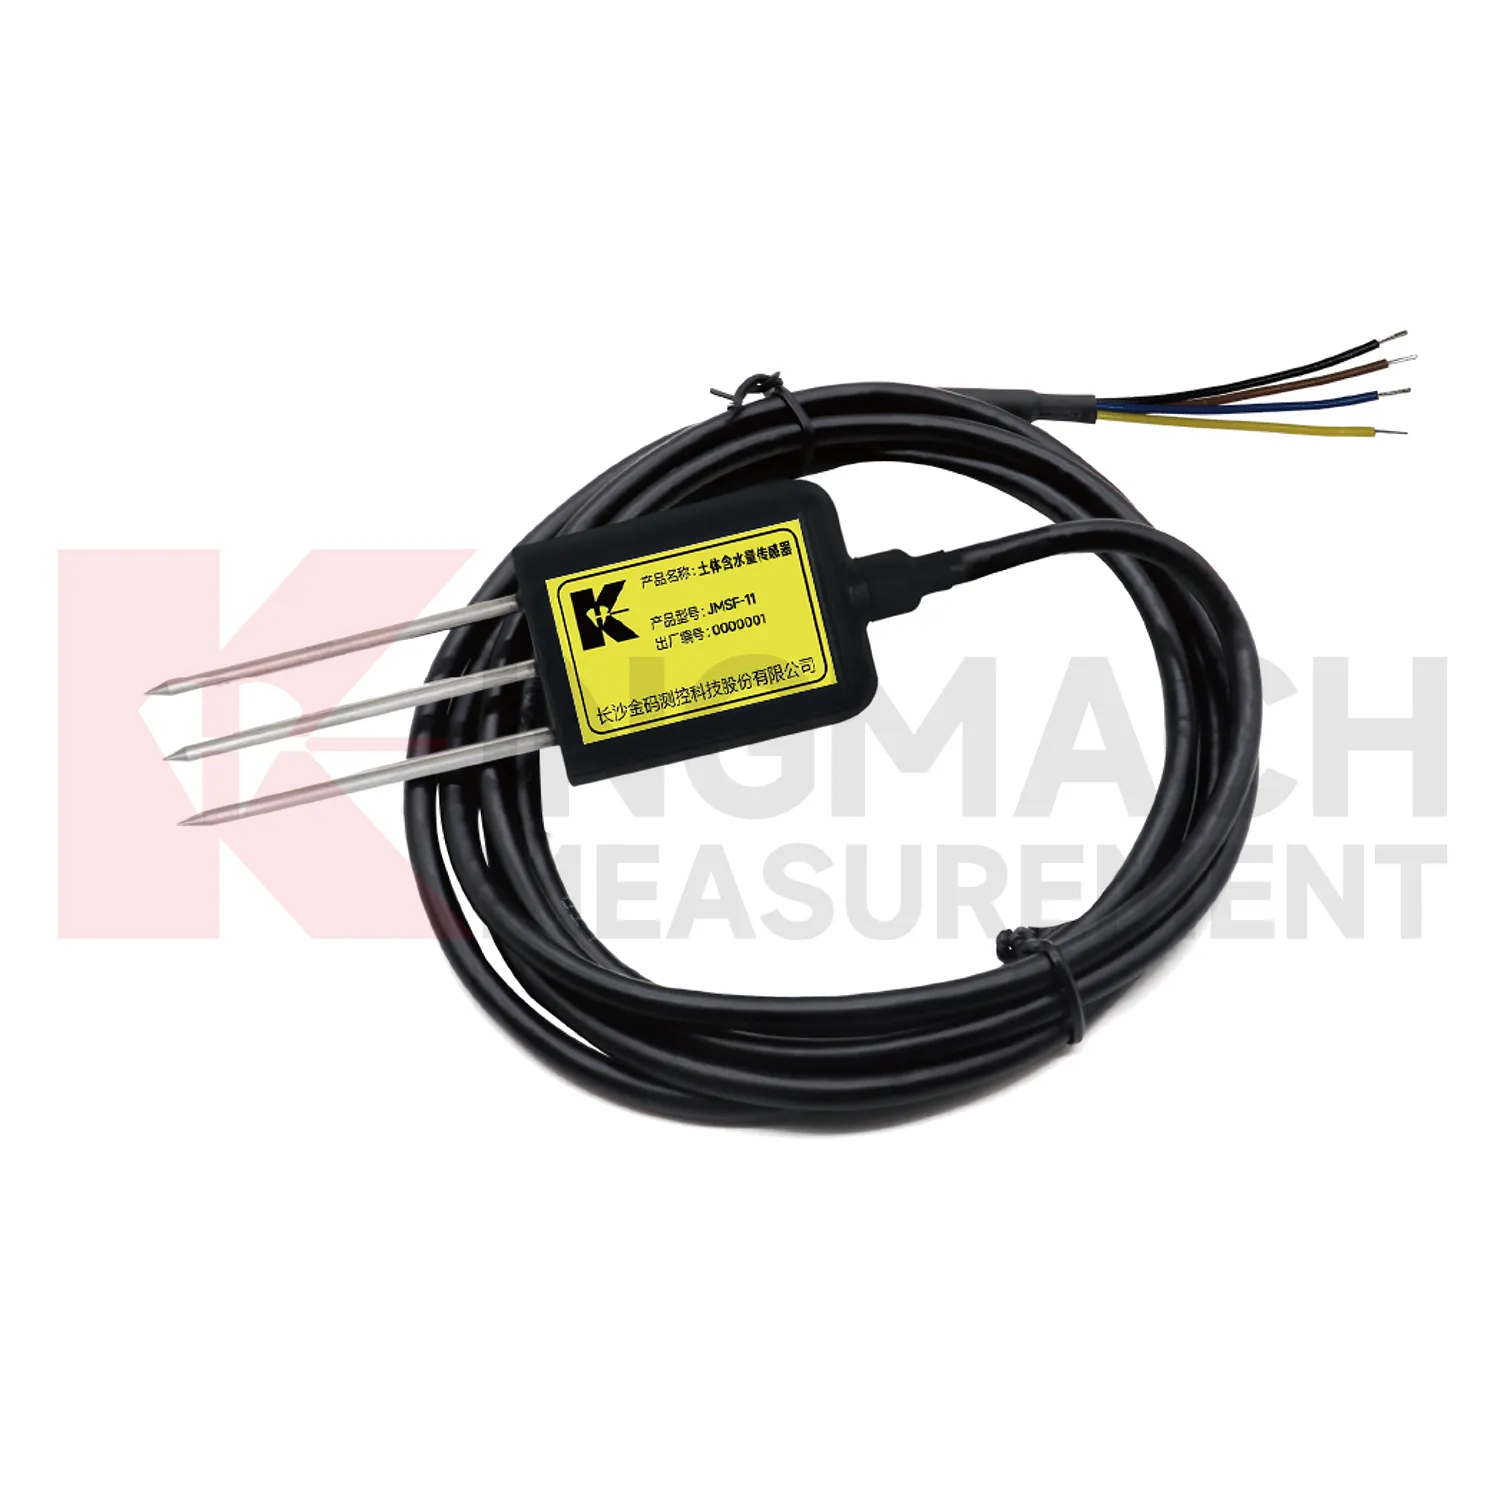
Geotechnical engineering uses Kingmach Temperature and Humidity Acquisition Module to explain how water and weather affect ground behavior. Soil wetness, rainfall, temperature, and humidity can influence slopes, embankments, foundation pits, tunnel portals, retaining walls, and reclamation areas. Environmental data should be reviewed with inclinometers, settlement sensors, displacement meters, pore-pressure records, and field inspections. A deformation curve during dry weather may suggest a different cause than a curve following repeated rainfall and rising soil wetness. Engineers also need to know whether construction work, loading, drainage changes, or excavation occurred during the same period. Environmental monitoring gives the missing condition layer, helping the team move from “the ground moved” to a more useful question: what changed around the ground before it moved?
If the reading seems unusual, the team should check the physical condition of the station before drawing conclusions about the asset. Blockage, poor exposure, loose wiring, water entry, and changed surroundings can all create misleading patterns.
A practical report links the condition value with time, place, and action. It should help a reviewer decide whether to keep observing, inspect the field point, compare nearby instruments, or record the event as normal site behavior.
For owners, the strongest record is the one that remains understandable after staff changes. Clear units, plain point names, installation photos, maintenance notes, and linked structural channels make the data usable beyond the original project team.
The future of Temperature and Humidity Acquisition Module
The future of Kingmach Temperature and Humidity Acquisition Module will focus on linking environmental triggers directly to structural behavior. Owners do not only need to know that rain fell, wind rose, or humidity changed. They need to know whether those conditions explain movement, strain, vibration, seepage, or equipment faults. Future monitoring reports should place condition curves and structural curves on the same timeline with inspection notes. That will make it easier to distinguish weather-driven behavior from progressive deterioration. The practical improvement is not more scattered data; it is clearer relationships. When environmental records are connected to the assets they affect, engineers can review alarms faster and plan field checks with better evidence.
This direction will also change how warning levels are written. A slope warning may depend on rainfall history and wetting trend, while a bridge warning may depend on wind period and structural response. Future systems should allow these links to be visible instead of forcing every channel into one isolated threshold.
For owners, the benefit is a shorter path from alarm to action. A reviewer can see the condition that changed, the asset that reacted, the inspection that followed, and whether the response returned to normal. That is more useful than separate charts that require manual reconstruction.
Care & Maintenance of Temperature and Humidity Acquisition Module
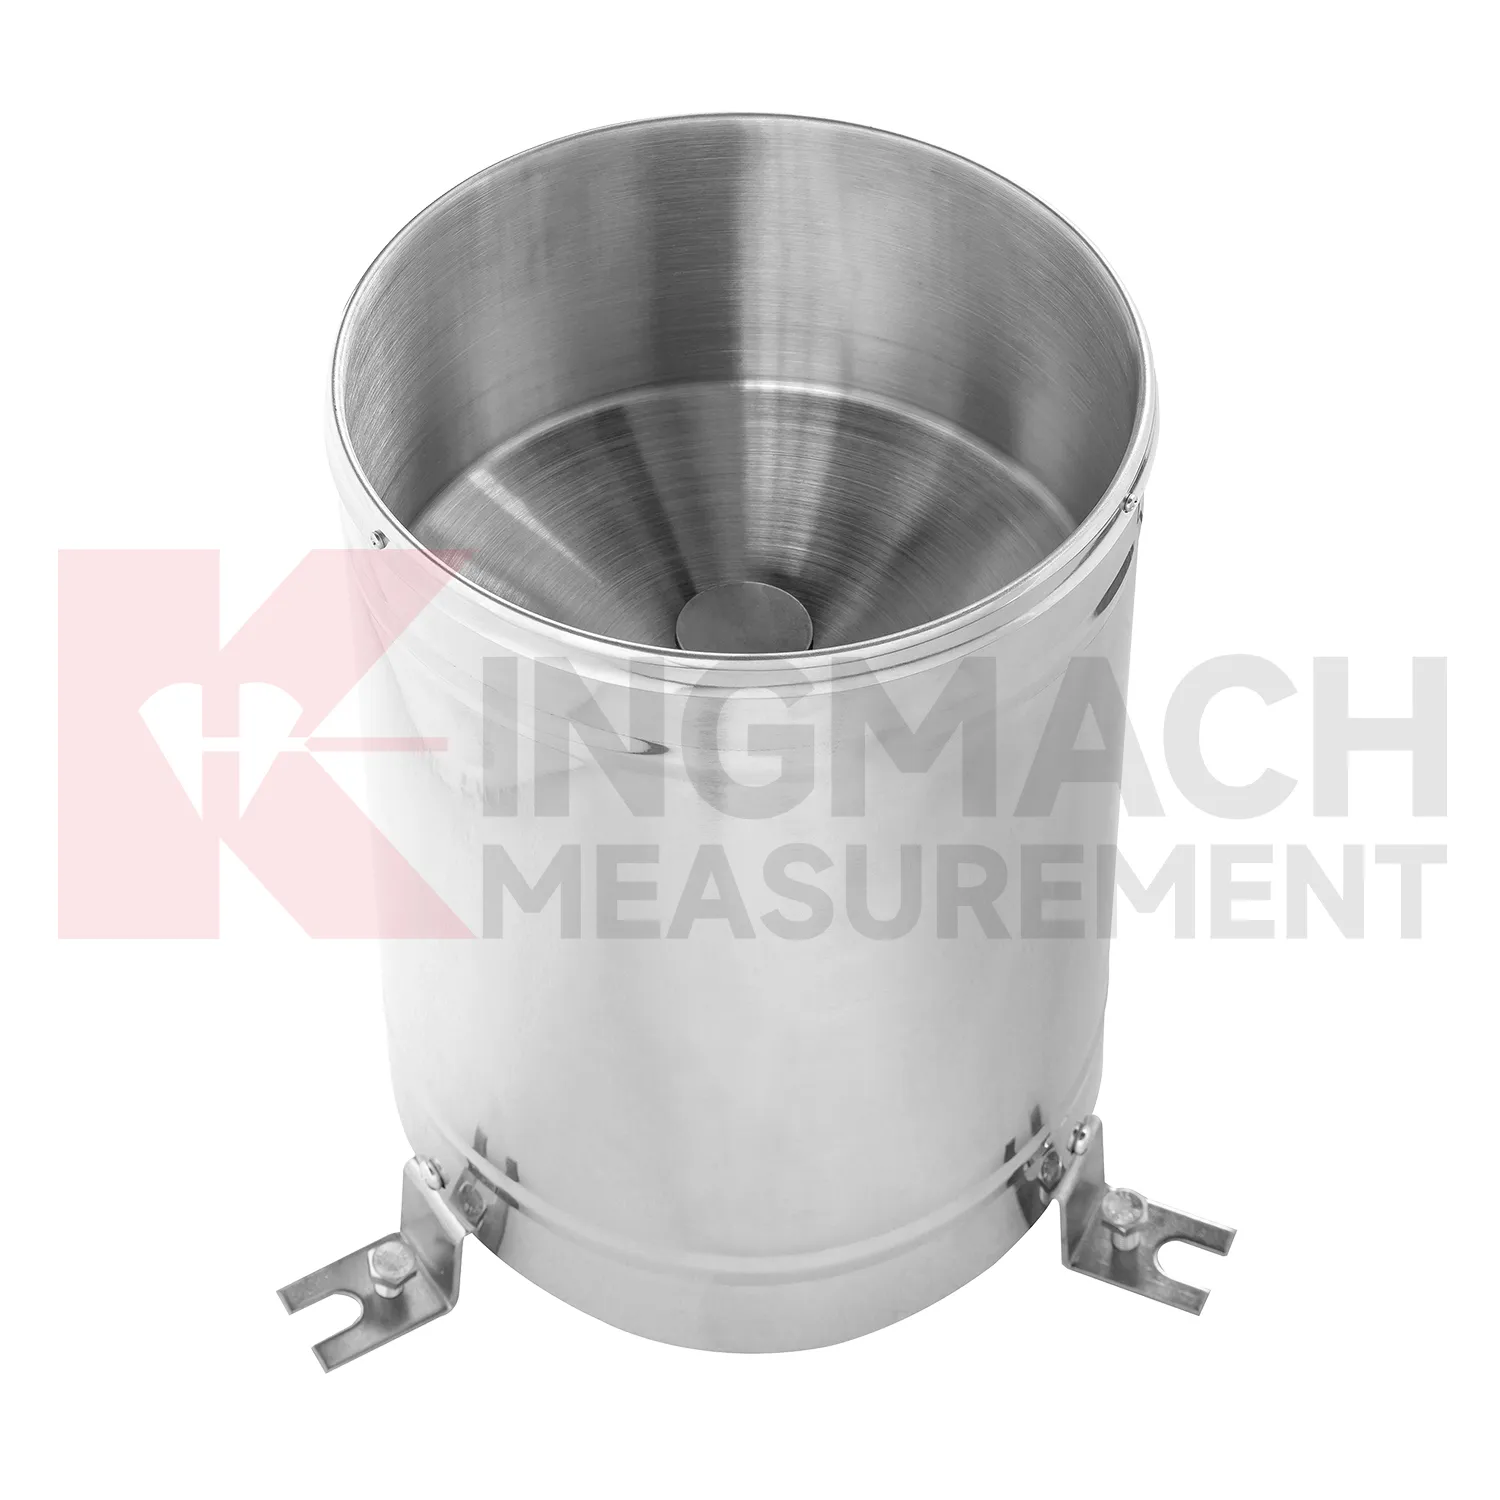
Rainfall maintenance for Kingmach Temperature and Humidity Acquisition Module should focus on keeping the catchment path clean and level. Leaves, dust, insects, scale, bird droppings, splash, and tilted mounting can distort rainfall records. The rain point should be inspected after storms, long dry periods, nearby earthwork, and seasonal debris build-up. Cleaning should be logged with date, condition, leveling status, and the first normal reading after work. Rainfall data is often used to explain slope movement, seepage, tunnel leakage, construction delay, or drainage performance. If the rain record is wrong, the engineering interpretation may also be wrong. Simple field care protects a much larger monitoring decision.
Maintenance teams should record cleaning, access difficulty, enclosure condition, cable repair, vegetation growth, nearby equipment changes, and the first normal reading after work. Those notes protect the meaning of the curve when old data is reviewed months later.
The environmental point should be part of a named monitoring question. It may explain wetting, drying, wind exposure, thermal movement, cabinet stress, or pressure variation, but that purpose needs to be visible in drawings and reports.
Kingmach Temperature and Humidity Acquisition Module
Kingmach Temperature and Humidity Acquisition Module is most useful when environmental data is treated as context for other measurements. Temperature can explain thermal expansion or sensor drift. Rainfall can explain slope movement, seepage, or delayed settlement. Humidity can affect cabinets, connectors, corrosion, and tunnel equipment rooms. Wind can explain bridge vibration, tower movement, or difficult access conditions. Soil wetness can help interpret embankment behavior and shallow ground response. These conditions do not replace structural instruments; they help those instruments make sense. A good monitoring file shows the environmental trigger, the structural response, the inspection note, and the time relation between them. That combination gives owners a clearer basis for maintenance and field decisions.
The installation file should explain why the location represents the monitored area. If the point is sheltered, shaded, exposed, buried, elevated, or placed inside an enclosure, that fact changes how later readings should be understood by maintenance staff.
During abnormal events, the first question is not only whether the value crossed a limit. The reviewer should ask what changed around the site, whether the related structure reacted, and whether a field inspection confirmed the same pattern.
FAQ
Q: Where should a rain point be placed?
A: It should be level, open to the sky, and away from obstructions, splash sources, roof edges, and debris-prone areas.
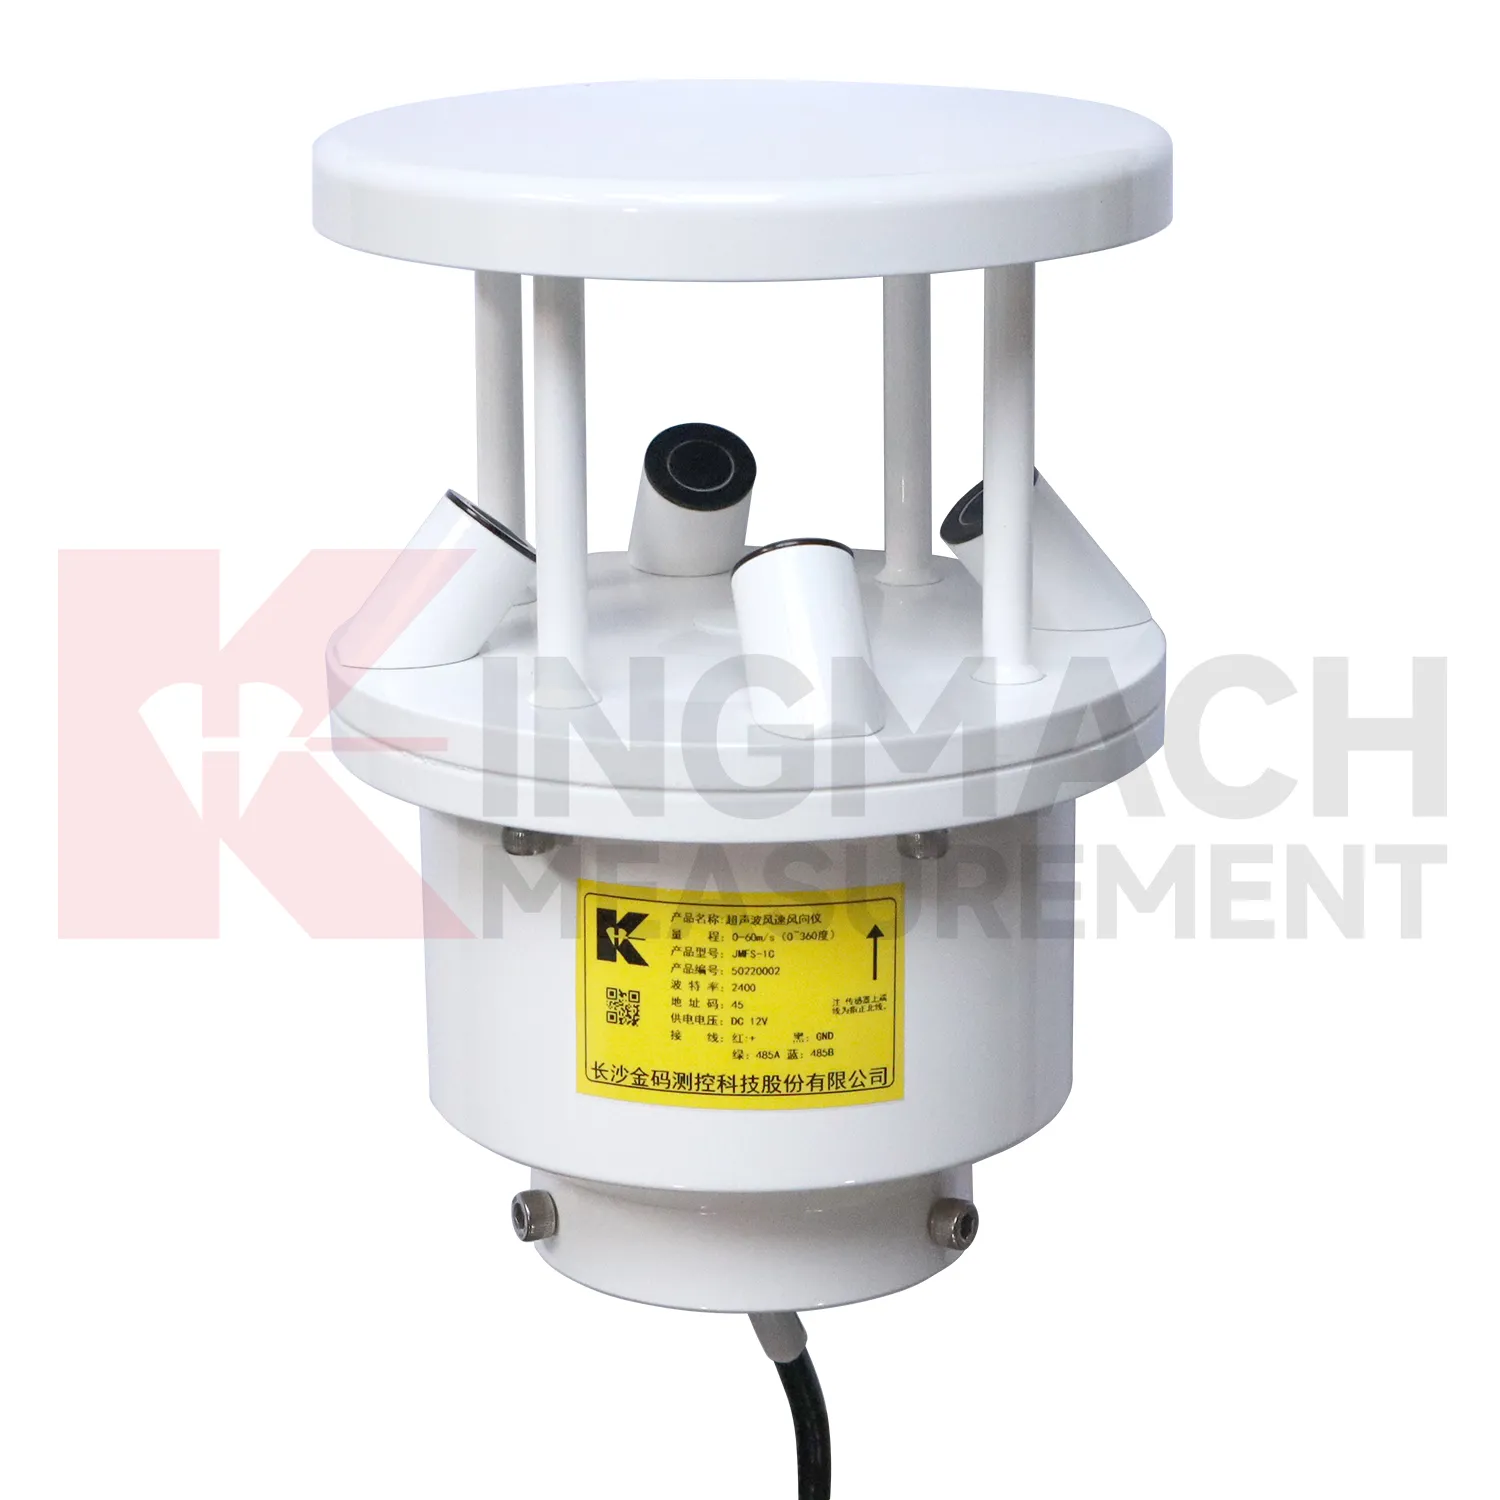
Q: Where should wind be measured?
A: Wind should be measured where airflow represents the asset or work area being reviewed, not behind a wall or sheltered obstruction.
Q: How should soil points be installed?
A: They should have firm contact with the surrounding soil, a recorded depth, protected cable route, and a stable first value.
Q: What should commissioning records include?
A: Include point location, measured condition, unit, mounting photo, cable route, power source, data channel, and linked structural record.
Q: Why are photos useful?
A: Photos help future reviewers understand exposure, mounting, cable routing, and whether later site changes affected readings.
Maintenance teams should record cleaning, access difficulty, enclosure condition, cable repair, vegetation growth, nearby equipment changes, and the first normal reading after work. Those notes protect the meaning of the curve when old data is reviewed months later.
Reviews
James Thompson
The tiltmeters and accelerometers are very sensitive and provide precise data. Perfect for our structural health monitoring system.
Andrew Lee
The visualization software is intuitive and powerful. It helps us analyze monitoring data efficiently.
Latest Inquiries
To protect the privacy of our buyers, only public service email domains like Gmail, Yahoo, and MSN will be displayed. Additionally, only a limited portion of the inquiry content will be shown.
Ava***@gmail.comAustralia
Hi, I am looking for reliable tiltmeters and accelerometers for structural health monitoring. Please...
Harper***@gmail.comIndia
Dear Sir, we are planning to procure a complete monitoring system including strain gauges, tiltmeter...
Related product categories
- tipping bucket rain gauge resolution 0.1 mm standard
- rain gauge tipping bucket
- tipping bucket rain gauge sensor
- tipping bucket type rain gauge
- tipping rain bucket gauge
- tipping bucket rain gauge 0.2 mm per tip standard
- tipping bucket rain gauge 0.2 mm resolution standard
- tipping bucket rain gauge data logger
- tipping bucket rain gauge resolution 0.1 mm typical
- tipping bucket rain gauge resolution 0.2 mm typical
- tipping bucket rain gauge typical resolution 0.2 mm standard
- typical tipping bucket rain gauge resolution 0.2 mm standard