
 EN
EN
 ar
ar bg
bg hr
hr cs
cs da
da nl
nl fi
fi fr
fr de
de el
el hi
hi it
it ko
ko no
no pl
pl pt
pt ro
ro ru
ru es
es sv
sv tl
tl iw
iw id
id lv
lv lt
lt sr
sr sk
sk sl
sl uk
uk vi
vi et
et hu
hu th
th tr
tr fa
fa ms
ms hy
hy ka
ka ur
ur bn
bn mn
mn ta
ta kk
kk uz
uz ku
ku
load cell wire diagram
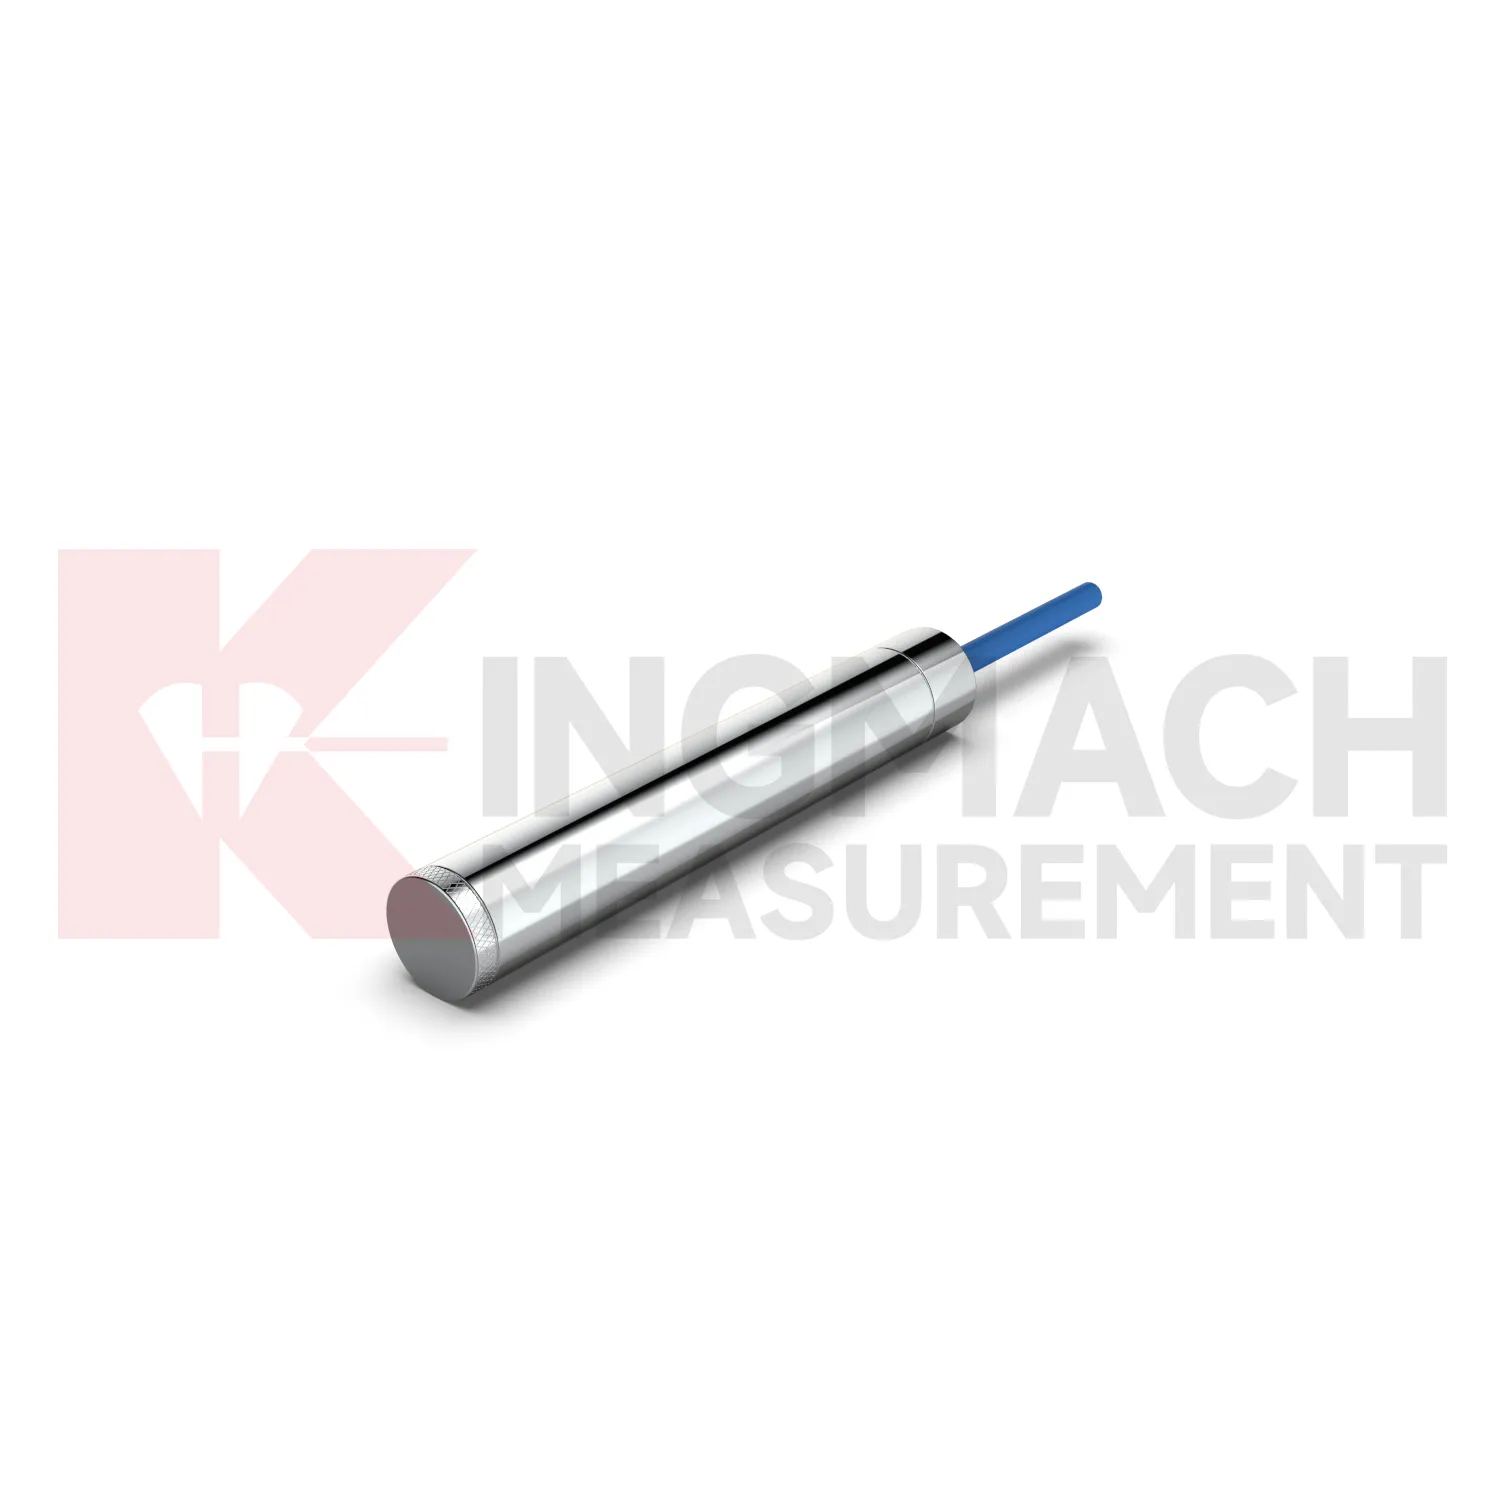
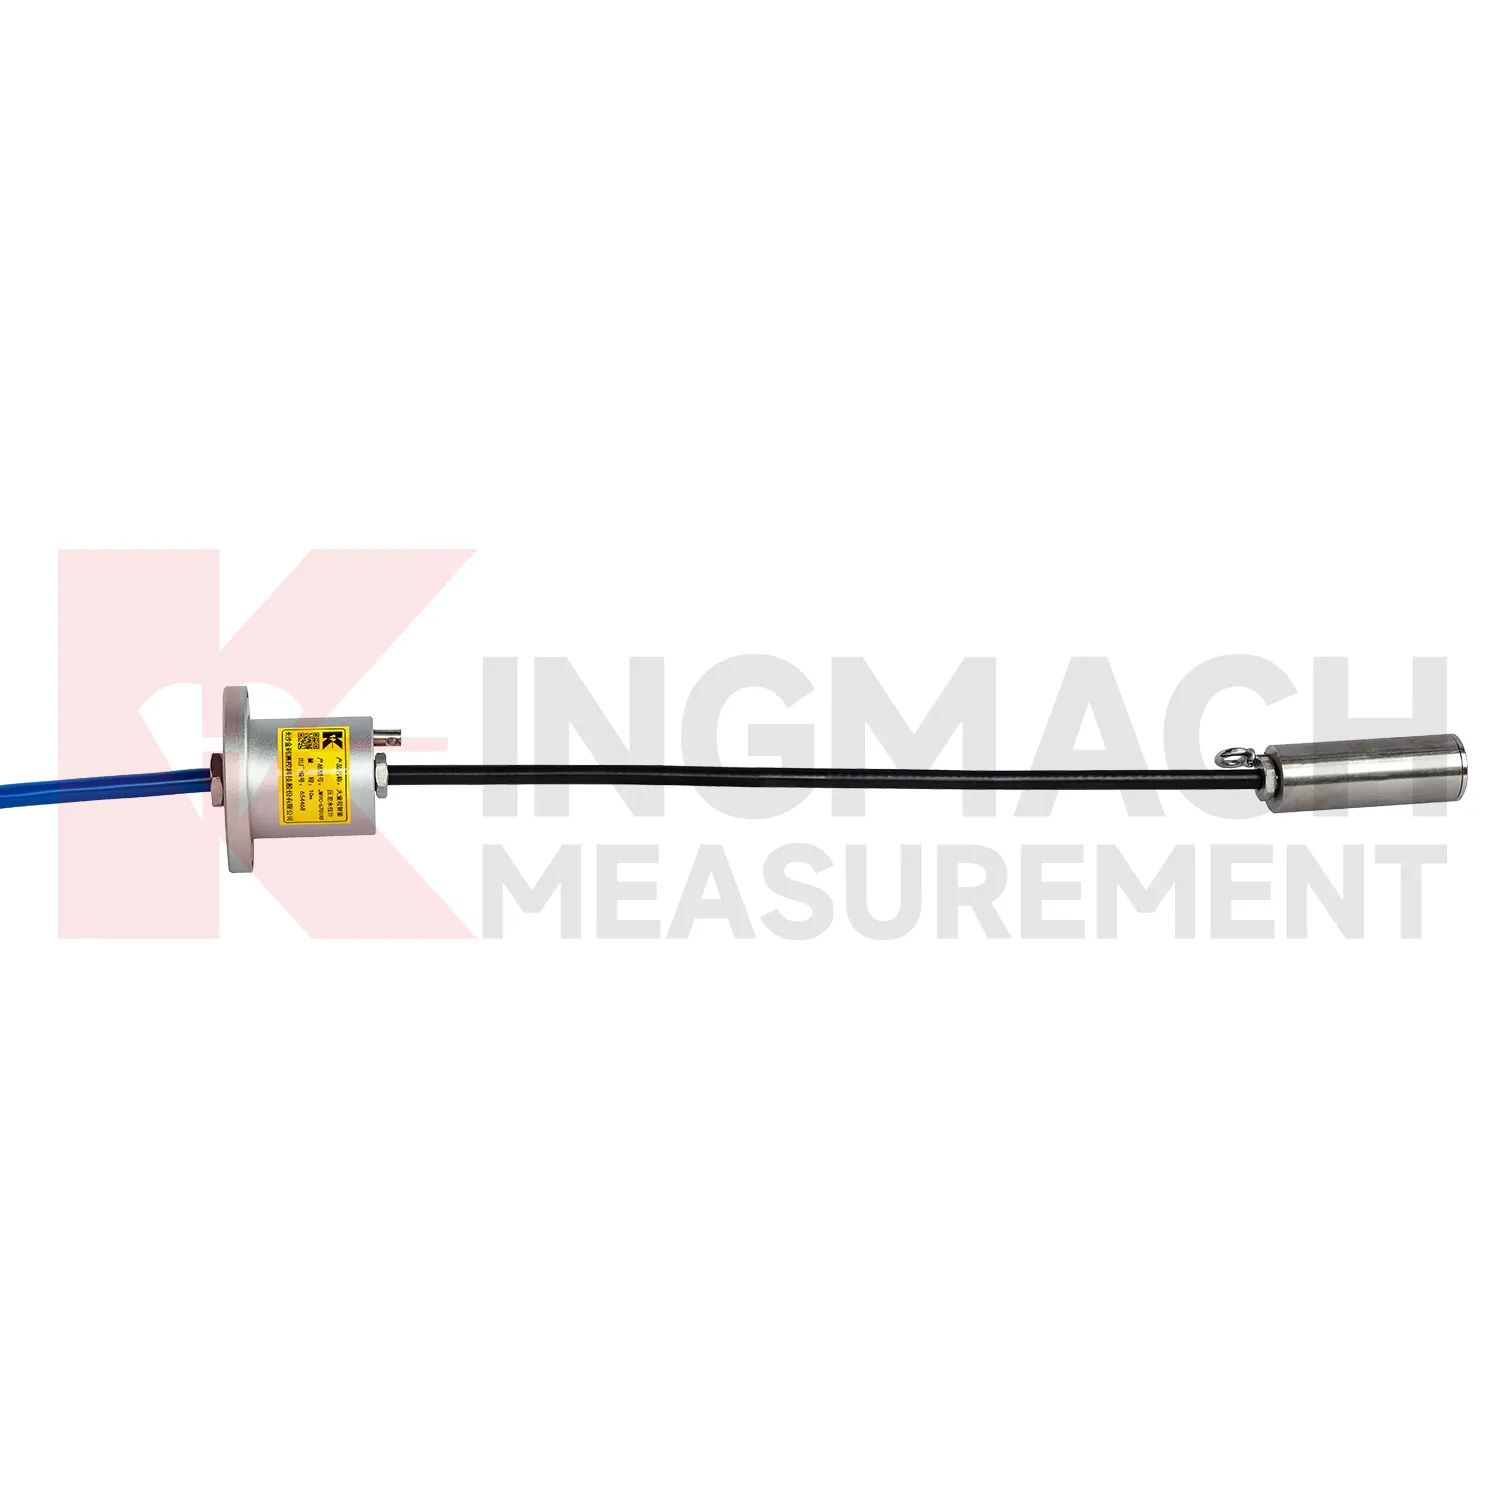
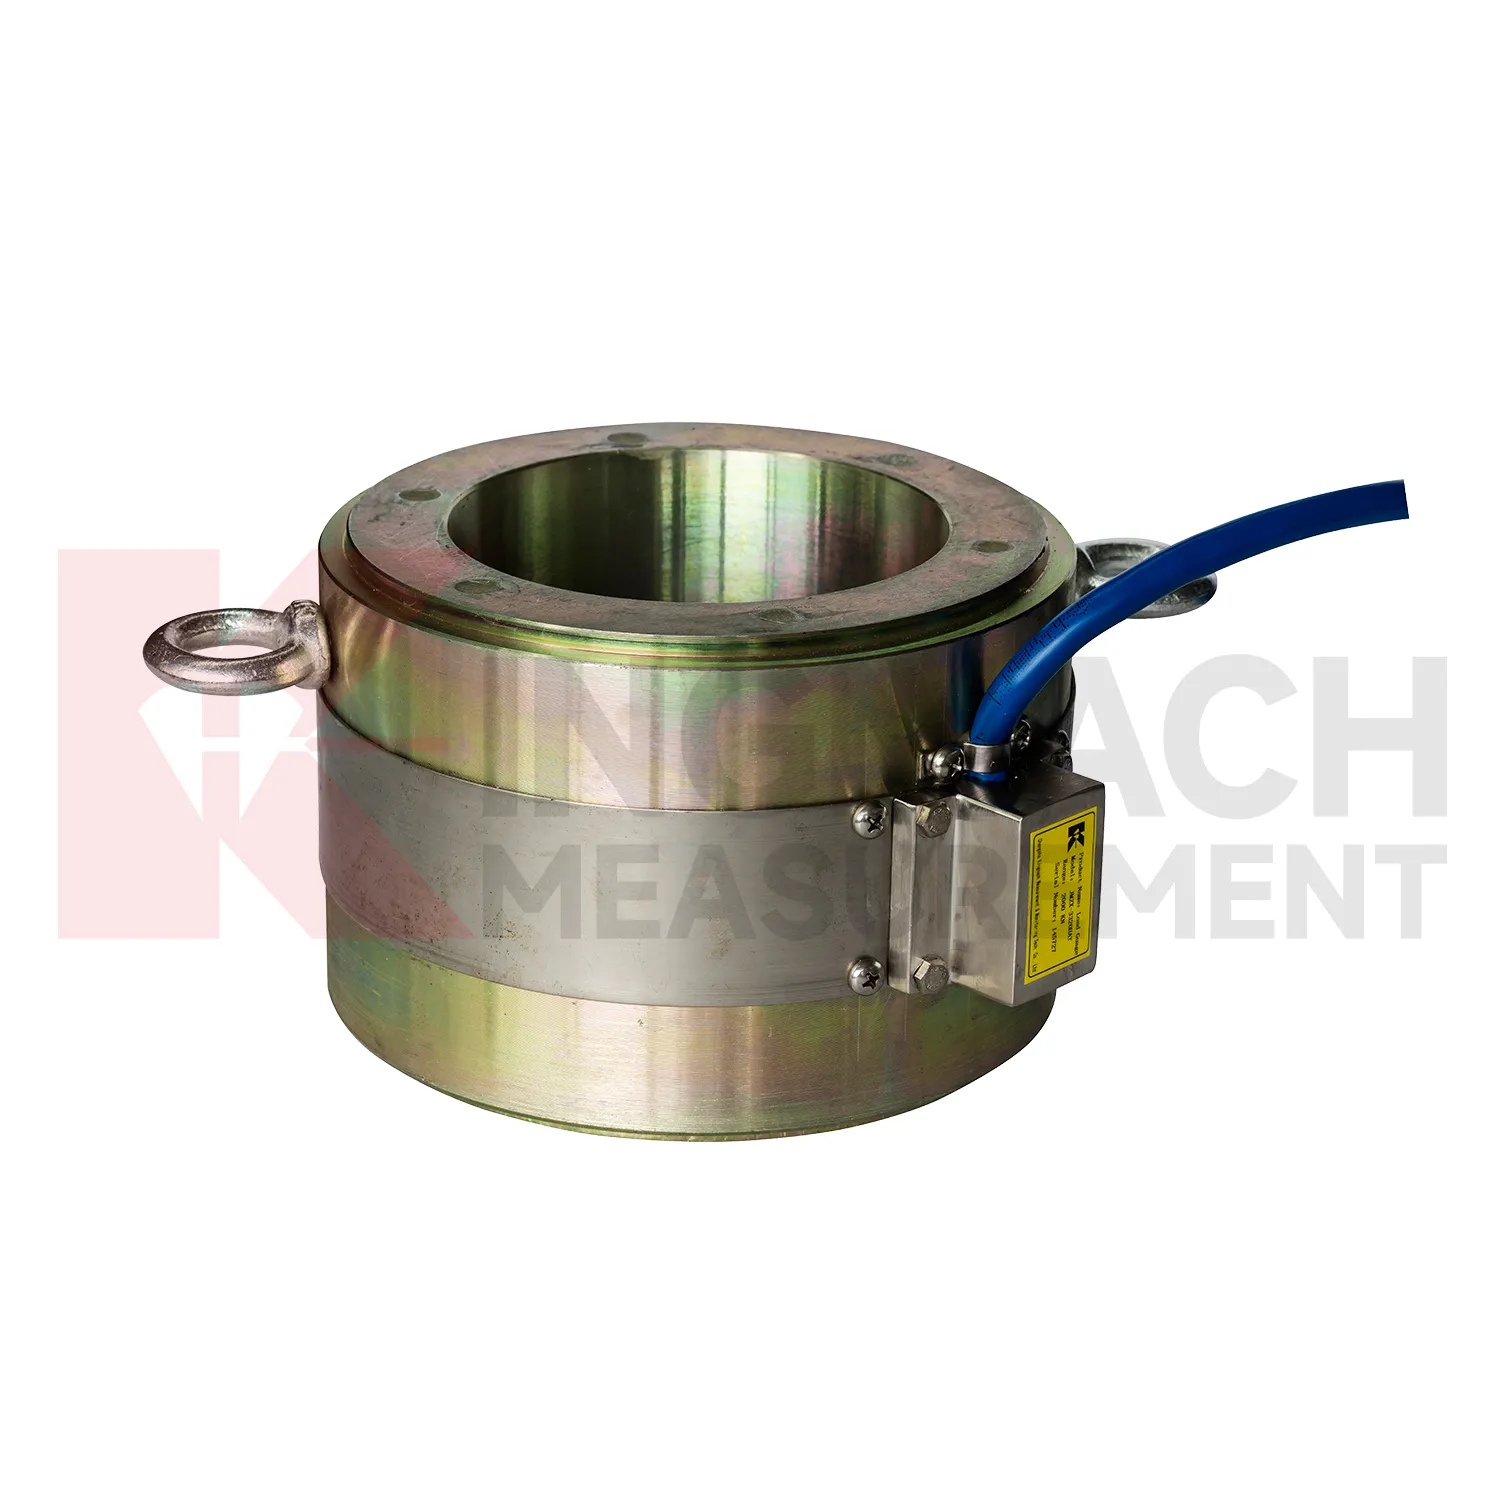
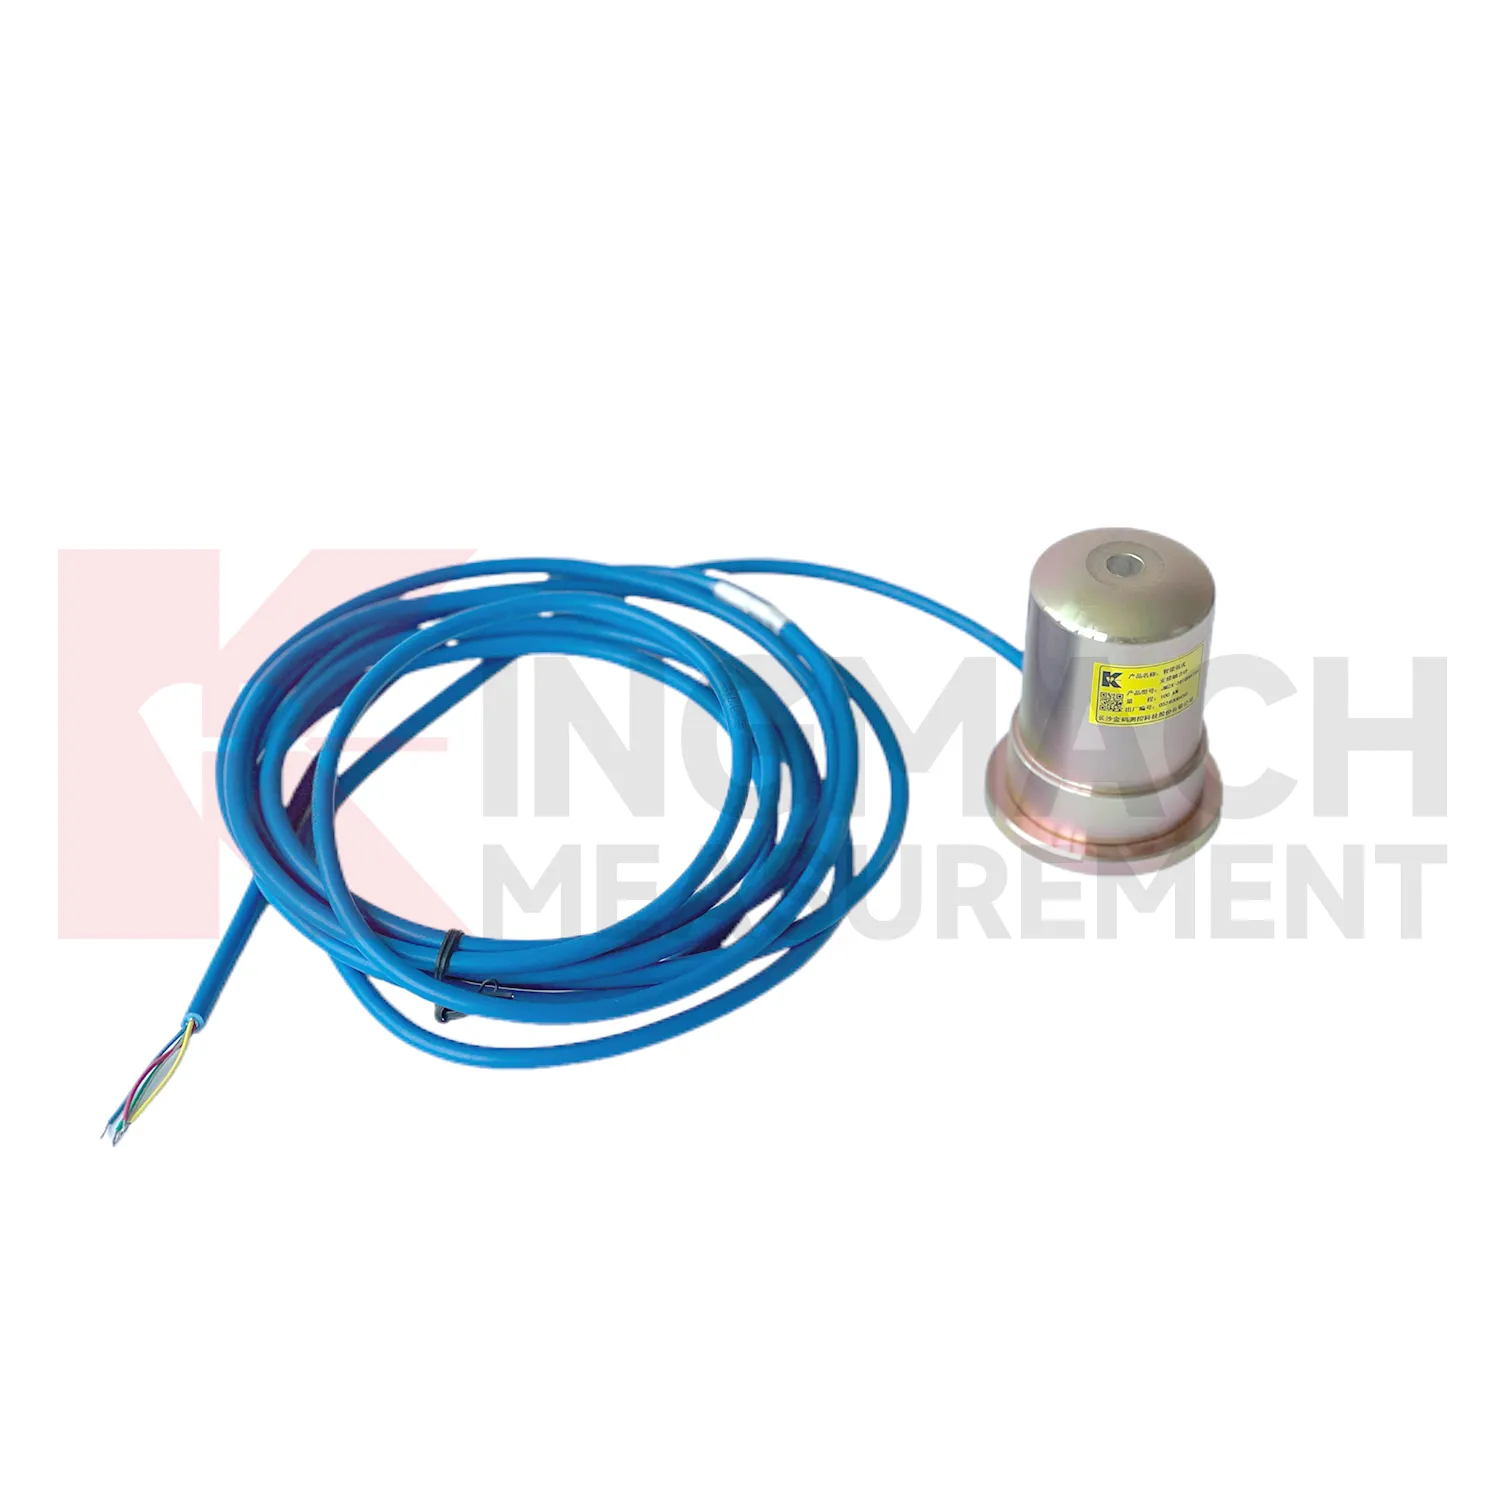
Kingmach load cell wire diagram product information is especially helpful during early engineering review because it gives model families rather than one generic device. The JMZX-3XXXHAT hollow load cell is tied to annular multi-string construction, elastic steel, ultra-high-strength vibrating wires, anchor welding, temperature correction, and 500 kN to 8000 kN ranges. The JMZX-35XXHAT solid load cell is tied to compression monitoring, 1000 kN to 10000 kN ranges, 0.1 kN resolution, and 0.5%FS precision. The JMZX-38XXHAT axial force meter is tied to steel support measurement, 200 kN to 3000 kN ranges, and 1 MPa waterproof performance. Those distinctions guide model selection before purchase. For a bridge, the force path may require hollow or solid construction. For a tunnel support, direct axial force display may be more practical. For soil pressure, MPa range and buried durability matter more than kN capacity. Matching the type to the load path prevents expensive changes after delivery. The product pages also show that standard models and customized versions may exist side by side. That is important because site geometry, force range, and available clearance may require confirmation before the load point can be ordered with confidence. It also gives the contractor clearer limits for installation geometry, cable routing, waterproof protection, and calibration review before the work reaches the field.
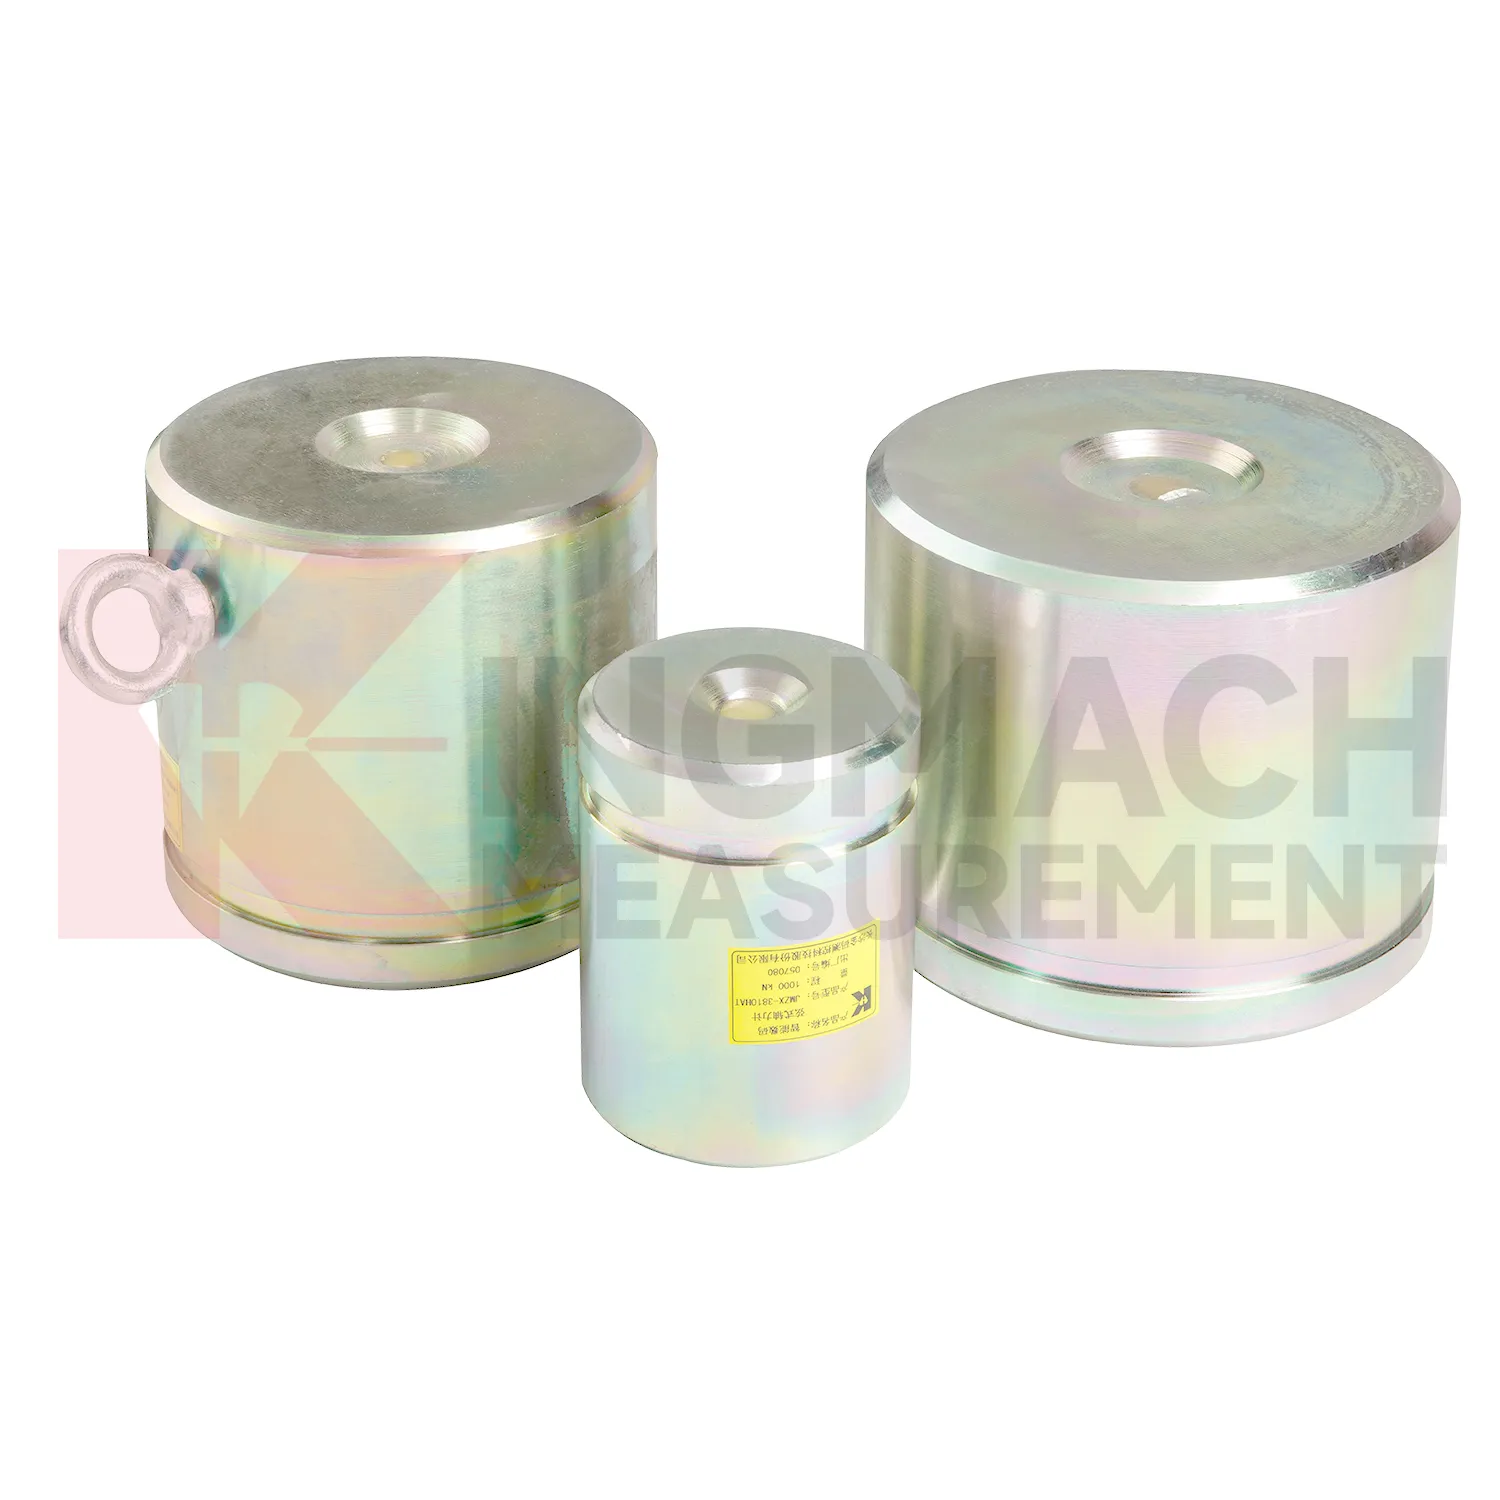
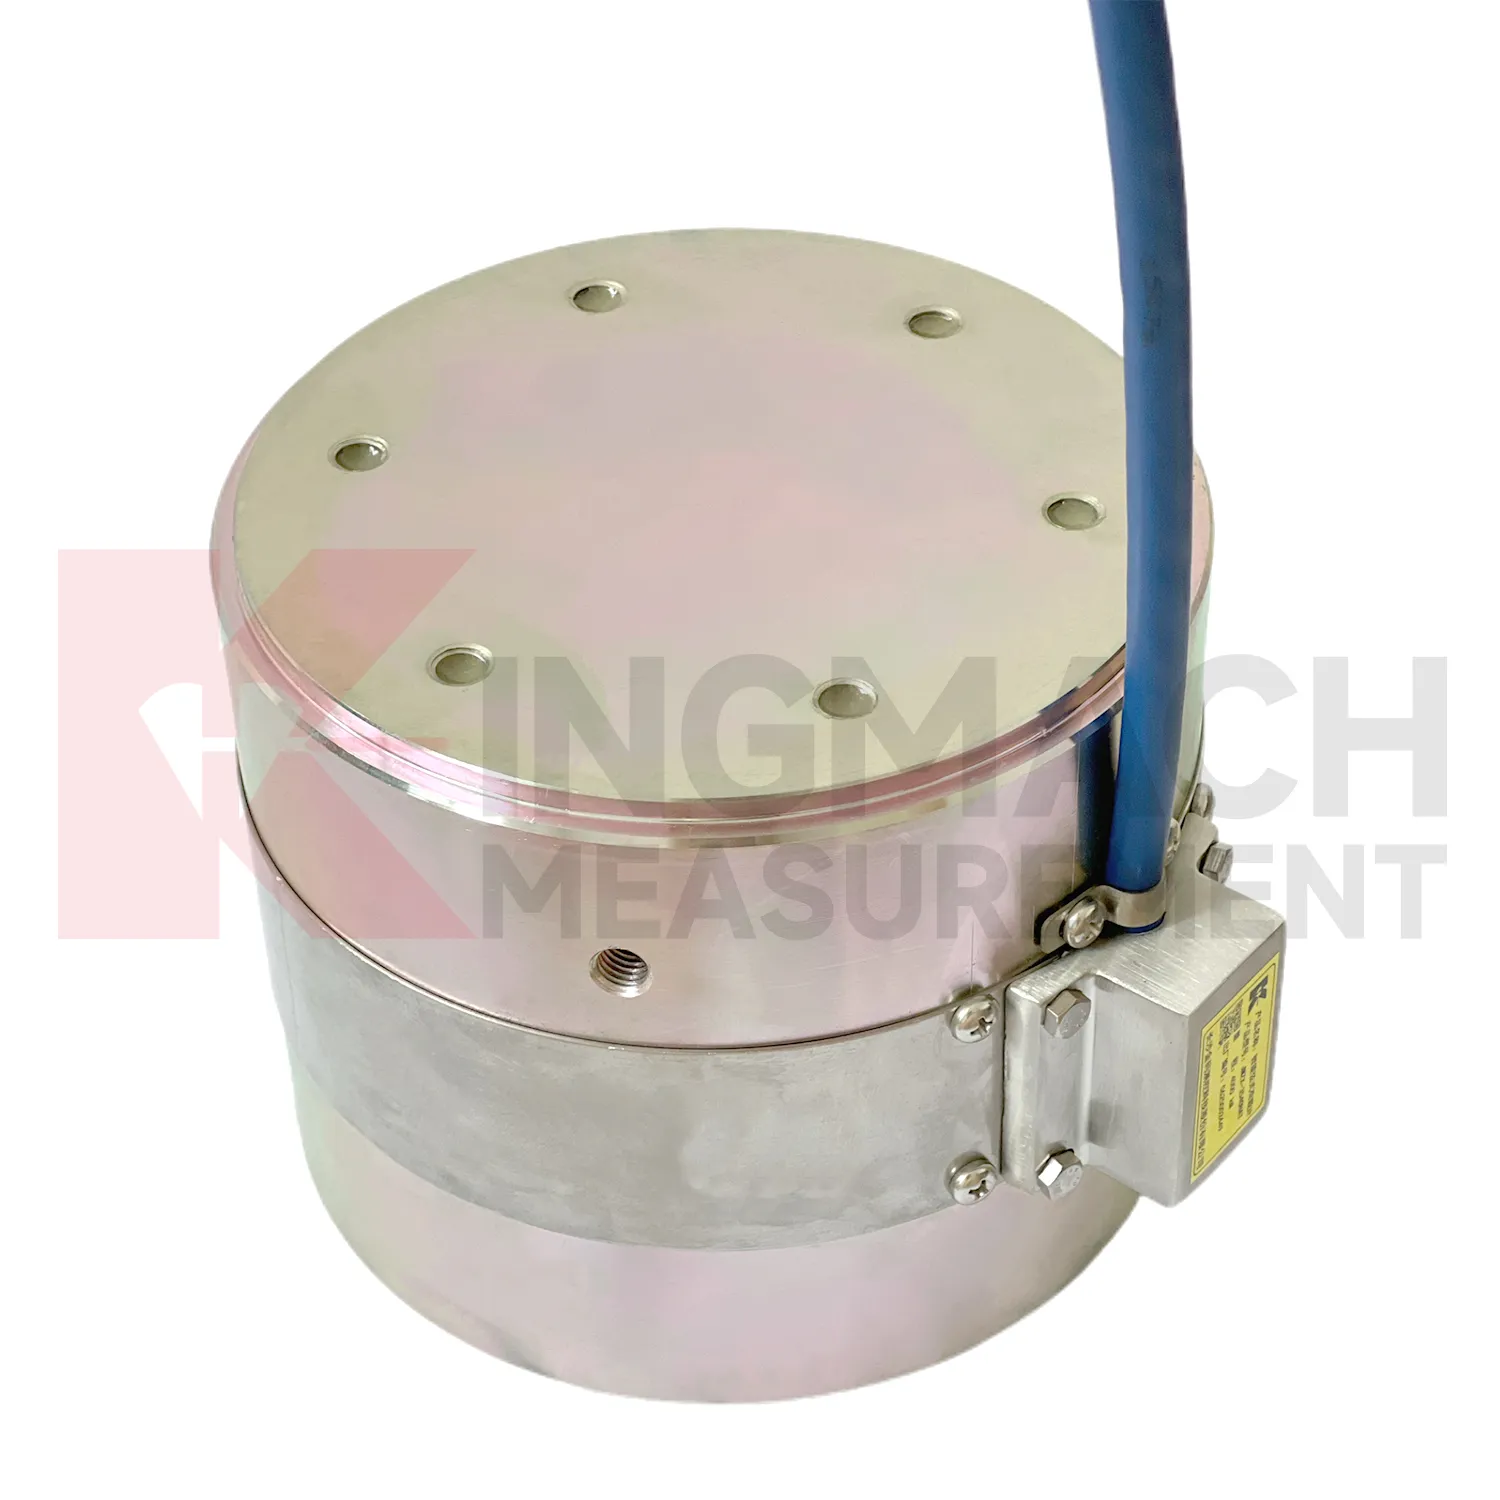
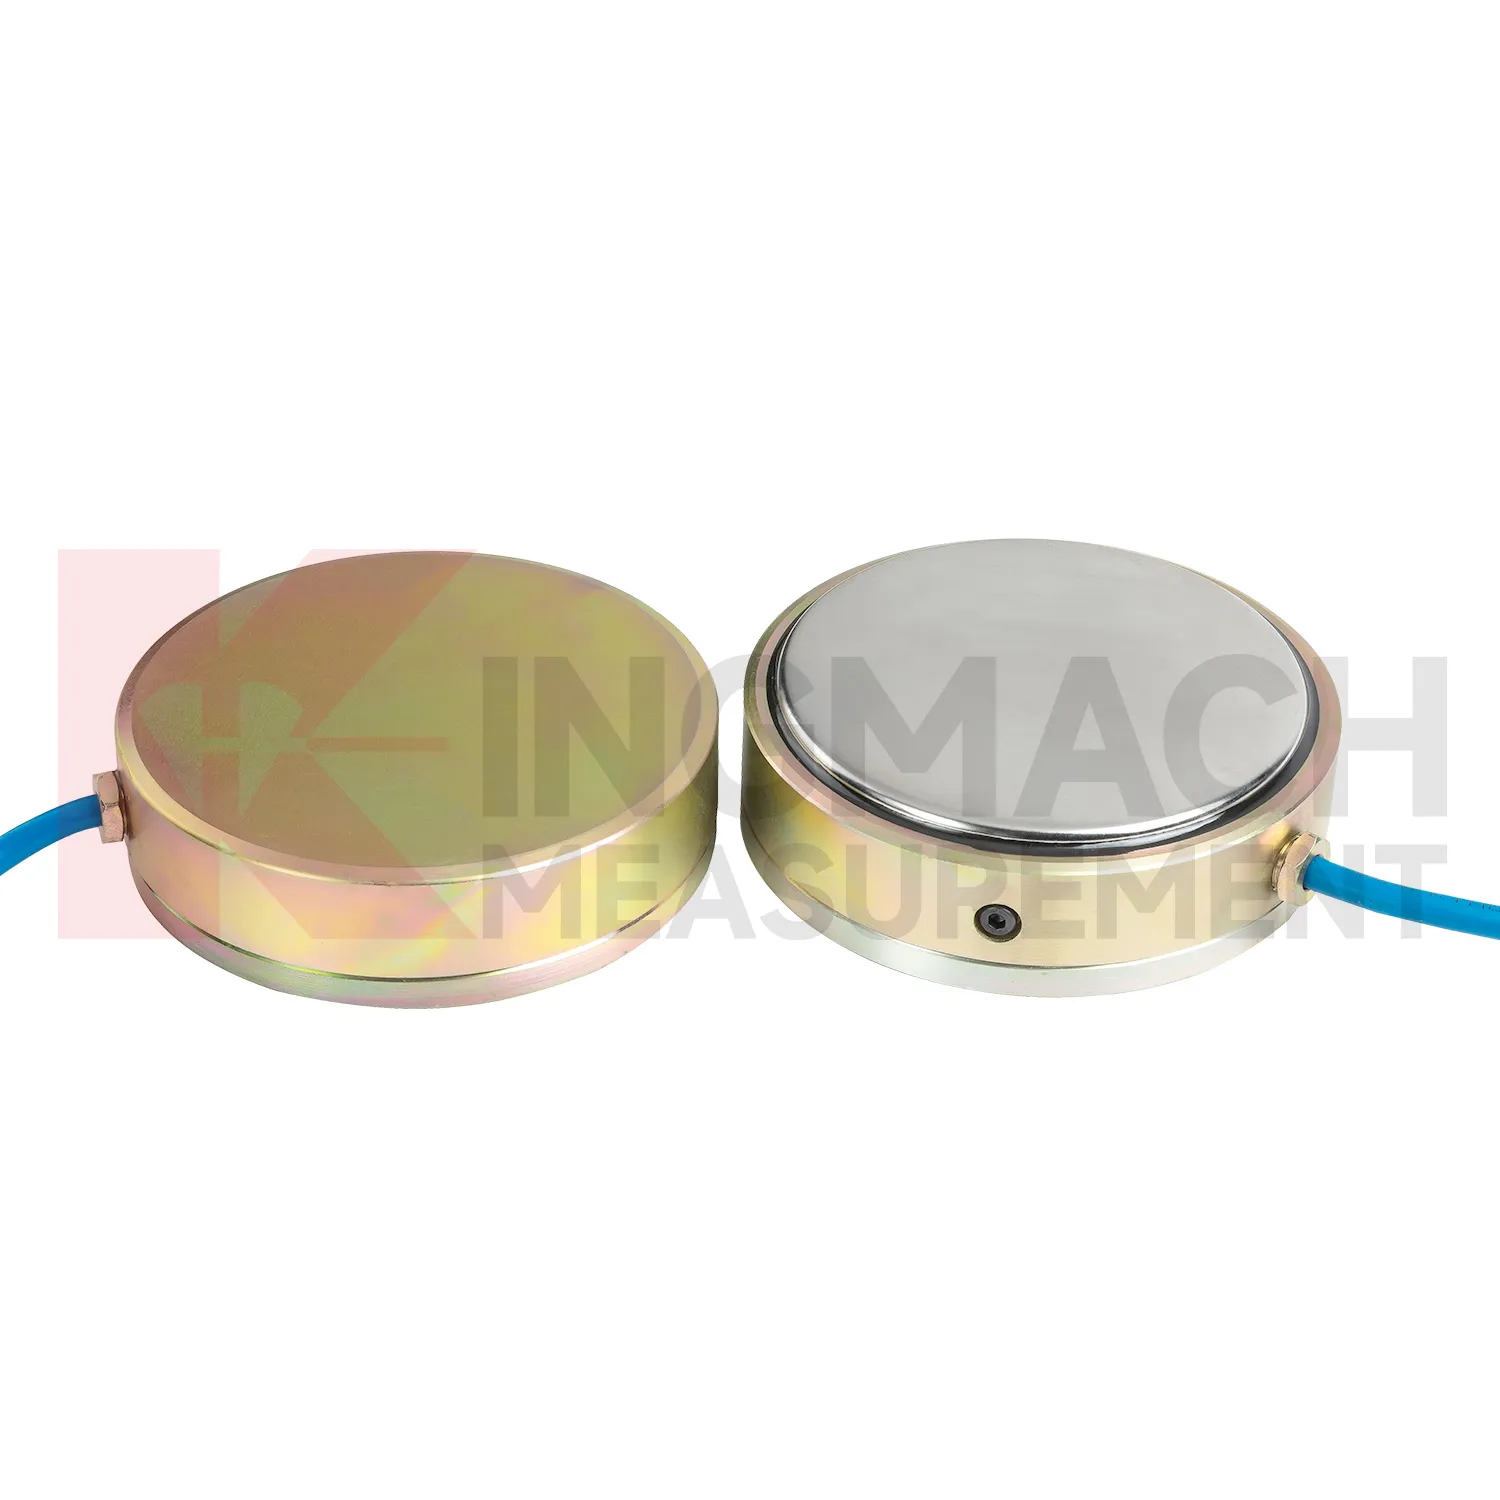
Application of load cell wire diagram
In dam and hydropower monitoring, load cell wire diagram can be used for anchor force, concrete bearing pressure, gate structure load checks, earth pressure near embankments, and long term load review around seepage control areas. The monitoring difficulty is durability. Access may be limited, water influence is persistent, and seasonal temperature changes can mask small force trends. Kingmach hollow load cells list a 50 year design life, waterproof durability, automatic temperature correction, digital output, and 800 stored measurement records. Earth pressure cells also list a 50 year design life, 0.5%FS pressure accuracy, and ±0.5°C temperature accuracy. These parameters support long observation periods, especially when readings are tied to reservoir level, seepage, rainfall, and temperature records. For dam owners, a single force value is rarely enough. The trend should show whether anchors remain stable, whether pressure increases after impoundment, and whether unusual readings appear near maintenance or water level changes. Automated acquisition is often worth planning where manual access is costly. For long service assets, the monitoring plan should also say who checks the reading after storms, earthquakes, reservoir level changes, or maintenance work. A sensor that is never reviewed at the right moment does not give the owner much protection.
The future of load cell wire diagram
Future load cell wire diagram design will keep moving toward lower maintenance without making the device harder to verify. Waterproof structures, high strength vibrating wires, automatic temperature correction, and smart chips already reduce field workload on Kingmach models. The next steps may include better connector sealing, self-diagnosis of signal quality, power efficient acquisition, and cleaner integration with cloud platforms. For remote dams, slopes, bridges, and rail corridors, LoRa, 4G, satellite, or wired hybrid systems may be selected according to access and power conditions. Long term data also needs stable units, channel names, calibration files, and inspection notes. Without those, a smart sensor can still produce a confusing record. Future procurement may therefore ask for sensor performance and data governance together: range, accuracy, service life, waterproof rating, memory, communication method, and exportable records. Kingmach's broad monitoring catalog is well positioned for this combined hardware and data requirement. Long life hardware still needs verifiable records around it.
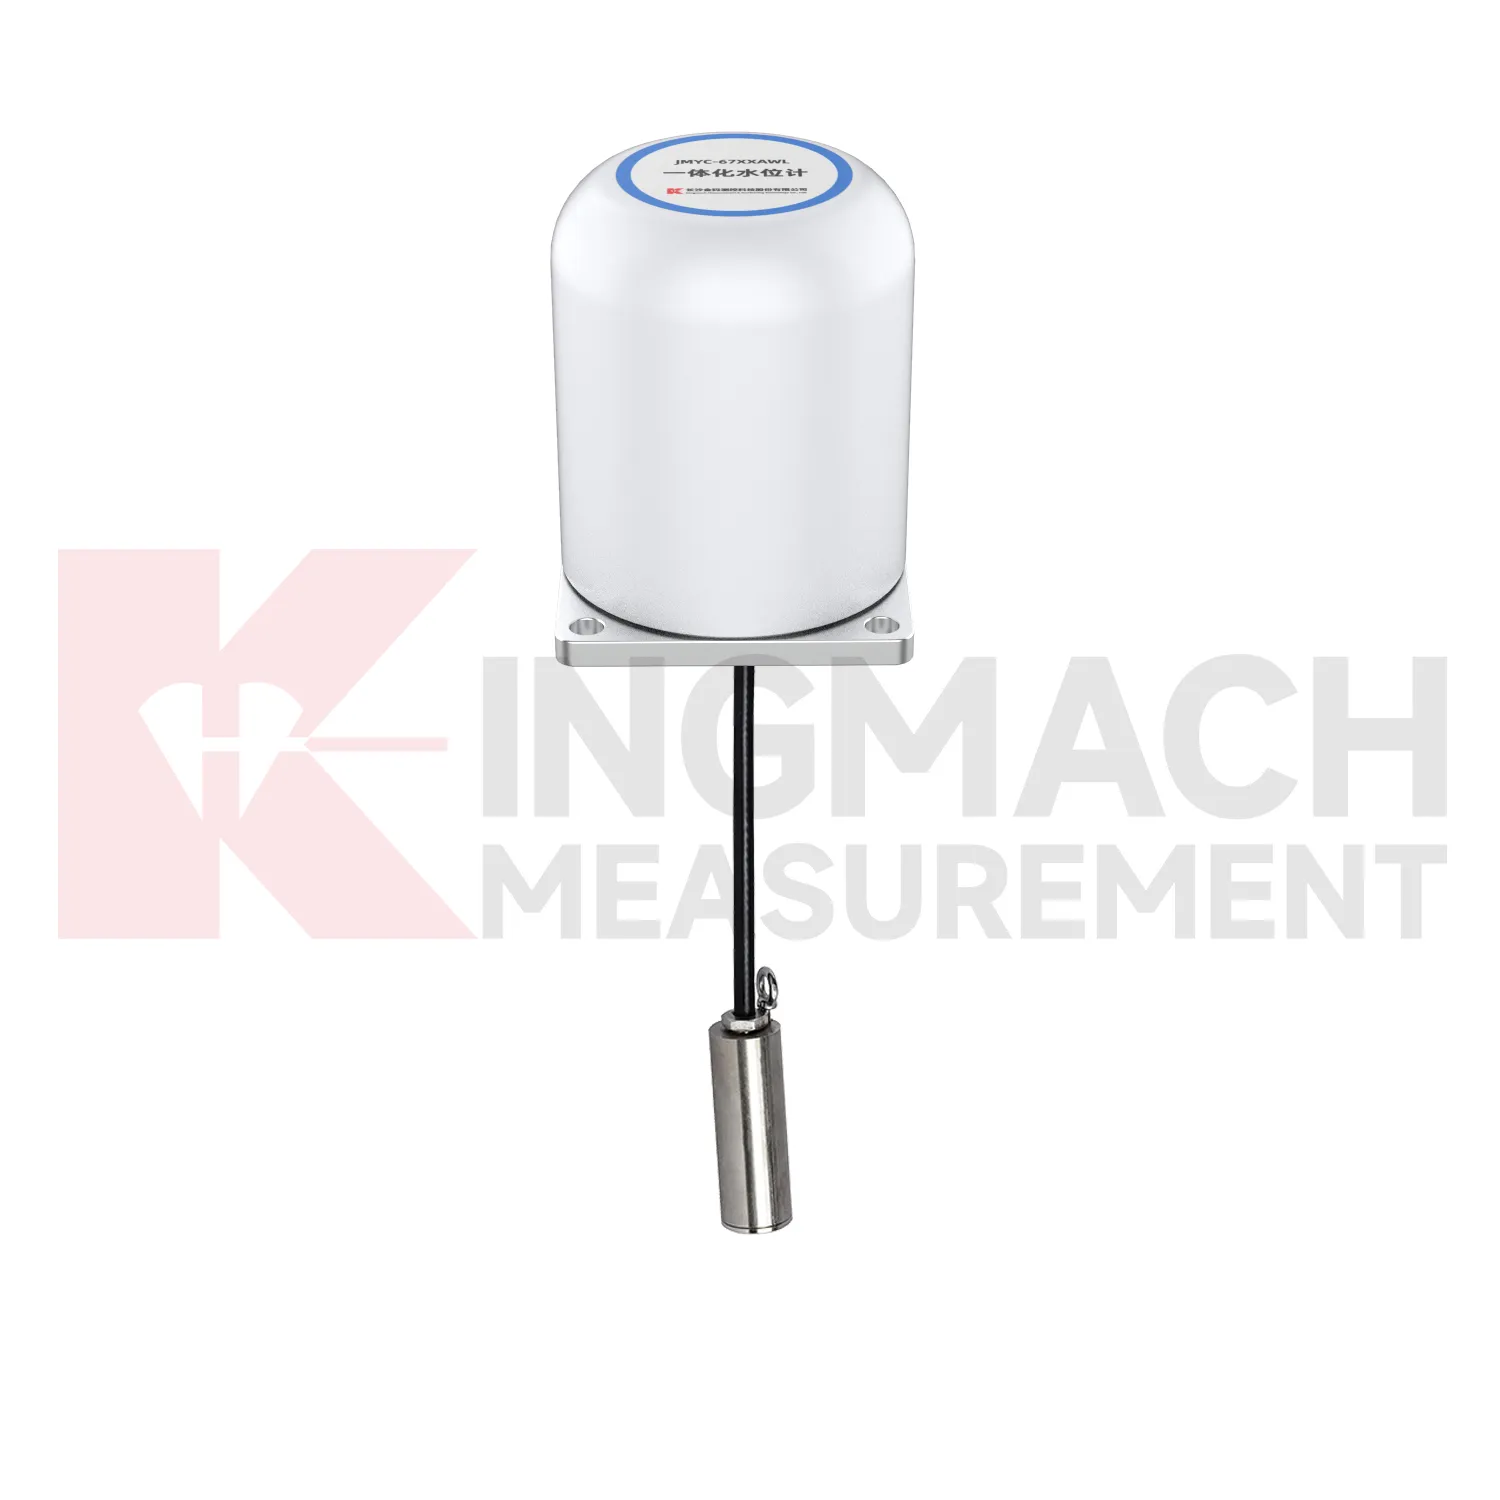
Care & Maintenance of load cell wire diagram
For load cell wire diagram in dam, slope, and embankment monitoring, long term maintenance should emphasize water resistance and traceable records. Some Kingmach load and pressure products list a 50 year design life, but cables, connectors, junction boxes, and exposed labels may age faster than the sensing element. During installation, keep the sensing face clean, avoid impact, secure the cable route, and document depth, location, orientation, and initial reading. Earth pressure cells with 0.3 MPa to 8 MPa ranges and 0.5%FS pressure accuracy should be checked against design pressure and burial condition. During operation, inspect after heavy rain, reservoir level change, freezing weather, nearby excavation, or maintenance work. Look for water entry, cable abrasion, rodent damage, connector corrosion, and channel mix-ups. Readings should be compared with water level, seepage, settlement, and slope movement. A slow drift may be real ground behavior, but only if the field hardware remains in good condition.
Kingmach load cell wire diagram
load cell wire diagram can be treated as a field witness for hidden force transfer in civil structures. Concrete, steel, soil, cable systems, and hydraulic loading may all look calm while the internal load path changes. Kingmach products in this category cover hollow load cells for anchors and cables, solid load cells for compression and pile testing, axial force meters for steel support loads, and earth pressure cells for contact pressure. Each type answers a different site question. Has the anchor lost tension? Is a pile test load centered? Is an excavation support taking more force after the next soil layer is removed? Is water pressure pushing the retaining structure harder after rain? The strongest monitoring records combine the sensor model, calibrated coefficient, zero value, temperature, reading time, and construction stage. That record gives owners a way to compare today with last week, last season, or the previous loading step, instead of relying on a single inspection note.
FAQ
Q: How can load cell wire diagram be connected to a monitoring platform? A: Use compatible readouts, acquisition modules, data loggers, DTUs, and software platforms according to site access, cable distance, power, and reporting requirements. Q: What makes smart models useful in large networks? A: Stored model data, calibration coefficients, zero values, temperature data, and measurement records reduce confusion across many channels. Q: Should manual readings still be kept? A: Yes, manual checks are useful after installation, maintenance, abnormal alarms, or logger changes. Q: How should alarm limits be set? A: Base them on design stage, sensor range, expected load change, temperature behavior, and nearby monitoring points. Q: What data should be reviewed together with force? A: Settlement, displacement, tilt, water level, pore pressure, rainfall, temperature, construction events, and inspection notes.
Reviews
Robert Taylor
The weir flow meter is well-built and delivers accurate measurements. Great value for water management applications.
James Thompson
The tiltmeters and accelerometers are very sensitive and provide precise data. Perfect for our structural health monitoring system.
Latest Inquiries
To protect the privacy of our buyers, only public service email domains like Gmail, Yahoo, and MSN will be displayed. Additionally, only a limited portion of the inquiry content will be shown.
Emma***@gmail.comCanada
Dear Sir/Madam, we are interested in displacement transducers and settlement sensors for a geotechni...
Mia***@gmail.comNetherlands
Dear team, we are interested in your readouts & data loggers compatible with multiple sensors. Do yo...